Table of Contents
- Introduction
- About Prometheus
- To-Do overview
- Scraping data
- The application
- Enabling Prometheus
- Enabling Grafana
- Final words
Introduction
Apache Camel tends to be a favorite choice when it comes to implementing a mesh of coordinated applications resolving protocol/data mediations and service orchestrations. Instead of a complex monolithic solution, deploying a number of smaller and simpler applications is preferable as it favours overall maintenance despite there being an increase in number of systems to control.

Monitoring is crucial when it comes to knowing the state of the platform. Tracking the system’s health tends to be a priority to ensure that business-as-usual activity carries on with normality. In addition to basic health metrics, such as CPU and memory usage, it might also be interesting to watch some other higher level indicators relevant to the organisation (more business related).
Conservative administrators would love a world where nothing changes, we can understand that, their work would be a lot easier and focused on some other important matters. And that’s precisely what container based environments aim to do, liberate people from tedious tasks by introducing smart automation strategies and standardisation.
With traditional monitoring products, machines and VMs are assigned to run applications, and all artifacts would be well registered in a resources catalog from which one could examine and obtain the relevant monitoring information. However, the traditional approach does not work on very dynamic and changing environments where containers (running the apps.) are created and destroyed all the time, as bubbles appearing and popping.

Evidently, by running dynamic environments we gain agility that allows easy scaling, provides elasticity, but then keeping track of what runs where becomes challenging. Here we discuss how Prometheus and Grafana can help you monitor your Camel applications running in a container based based environment (Kubernetes).
About Prometheus
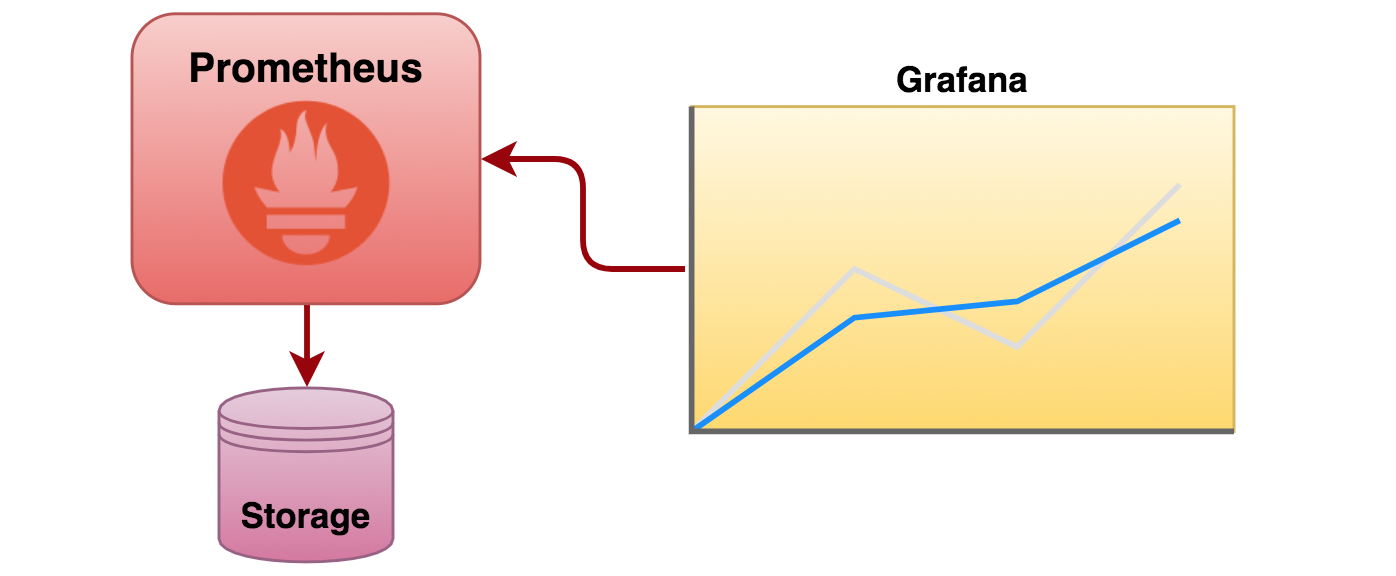
Prometheus is an open source monitoring and alerting toolkit which collects and stores time series data. Conveniently it understands Kubernetes’s API to discover services. The collected data can be intelligently organised and rendered using Grafana, an open analytics and monitoring platform that can plug into Prometheus.
The following diagram depicts a simplified view of its architecture.
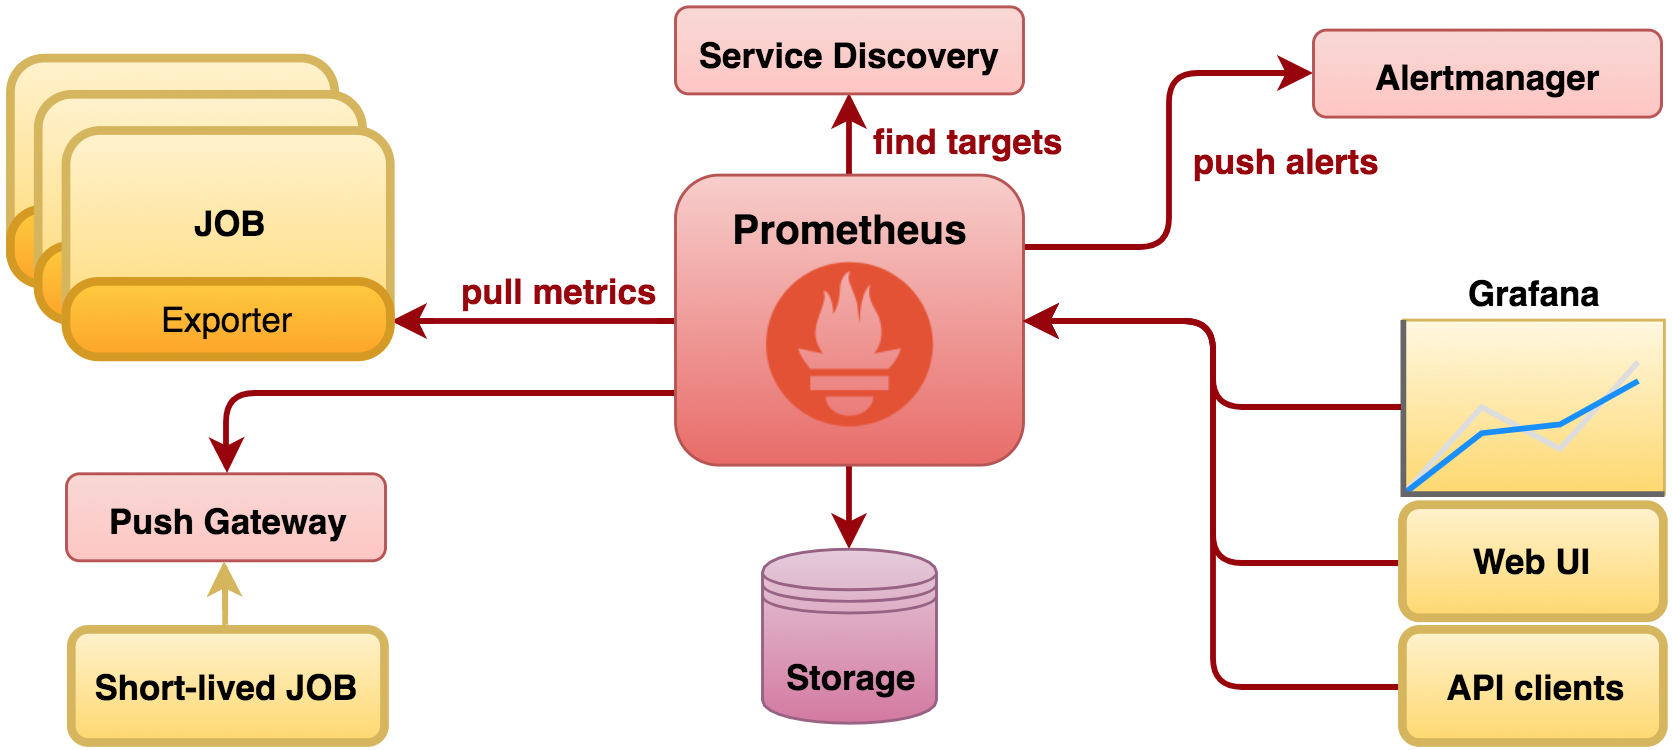
Prometheus prime strategy is to pull metrics from applications (although ‘push’ is also supported). Connectivity to endpoints can be statically configured or dynamically discovered. Data obtained from endpoints is stored so that historical information can be served to external clients, including monitoring tools such as Grafana. Alerting is supported, although left out of scope in this article.
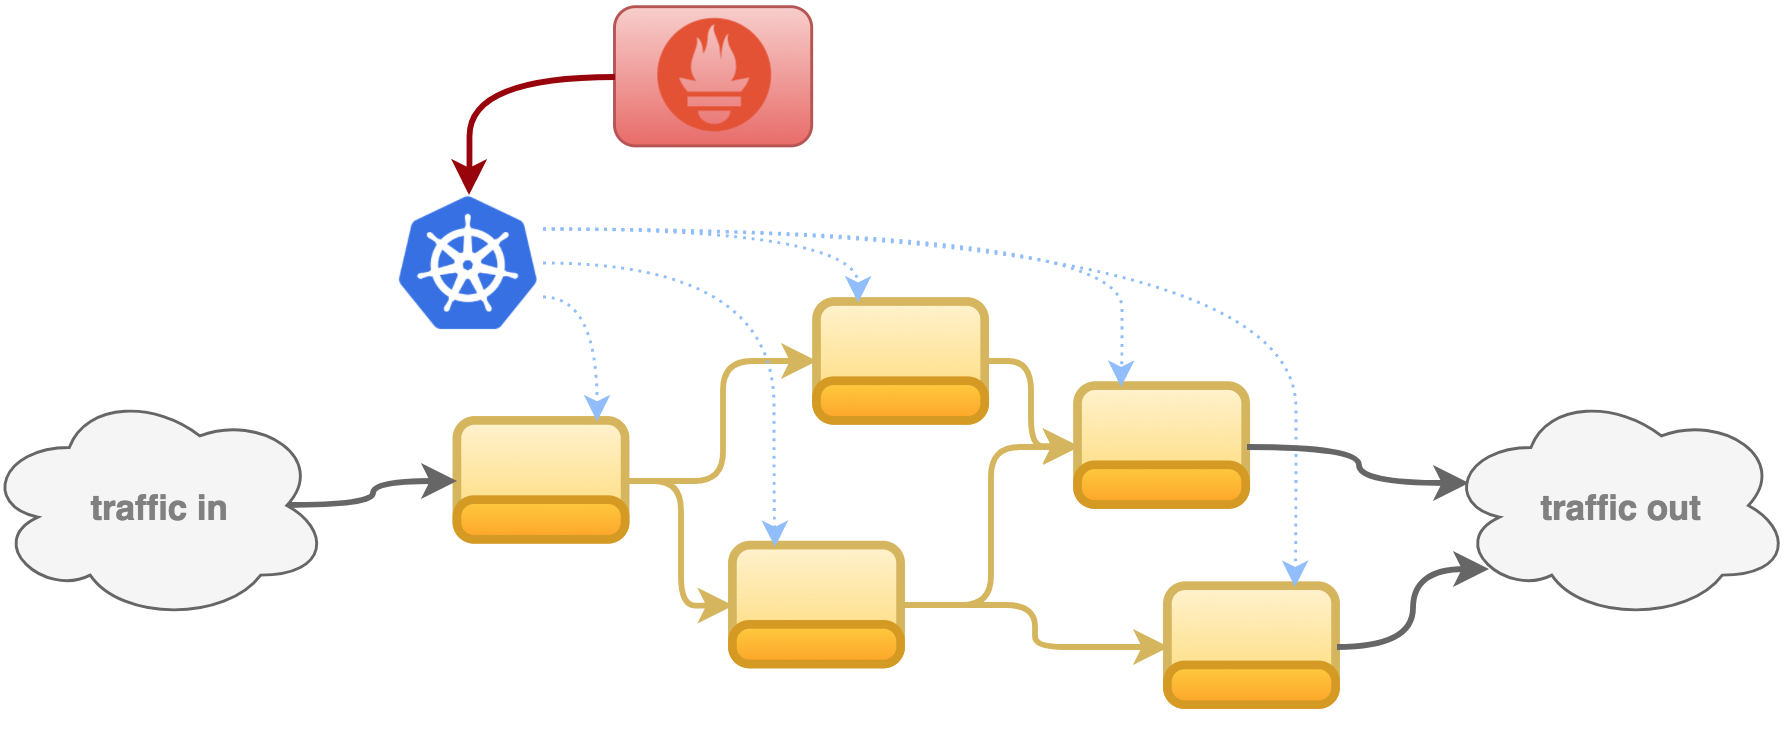
In a Kubernetes environment, track of available services is always maintained. Services could be served by one or multiple replicated instances, scaled up or down when necessary. Before Prometheus can pull data from the instances, it needs to find where they are running. One of its supported service discovery mechanisms is Kubernetes based, and by invoking its API it can pull all the details from Kubernetes and locate the targets to work with.
To-Do overview
Let’s pause for a second and quickly set the scene about our intentions, along with the simulated requirements:
- We’ll be using Camel to build our application (API service)
- We’ll be deploying in a Kubernetes based environment
- We need to scale up and down to meet demand
- We need to monitor both health and business metrics
- We need a single pane of glass when graphing the data.
All in all, the list below enumerates the building blocks to put together:
To model the Camel application (and for convenience), I’m selecting Fuse Integration Services (FIS), from Red Hat (where I work). And my Kubernetes environment of choice will be Red Hat Container Development Kit (CDK), perfect for local development.
Scraping data
It hasn’t been mentioned yet how desirable it is to find a metrics extraction that minimises intrusion. Prometheus offers a JMX exporter to plug into any Java application (and hence to Camel). The performance impact on the application is negligible (nano-seconds), unless of course latency is considered a critical factor.
Prometheus offers a wide range of exporters, from hardware related ones, to databases and many more in between.
The JMX exporter ensures no adapted development is necessary. The only obvious exception is when needed to obtain business specific information out of the transaction’s payload.
The process of collecting metrics, in Prometheus jargon, is called ‘scraping’. The following picture depicts how the JMX exporter would sit along the JVM (as a Java agent) to expose metrics to Prometheus.

quick note:
Out of curiosity, Prometheus will also help you to obtain metrics from hardware, network devices and other elements, it’s open and not restricted to software only.
The Camel example to follow includes 3 layers (JVM, Camel, Business) of metrics to be scraped to illustrate typical information that be may relevant when monitoring. JVM and Camel metrics are available out-of-the-box, MBeans are already present to serve the information. Optionally we can extract business KPIs, thankfully Camel provides functionality to help in this matter, the 'camel-metrics' component, shown later down the article.
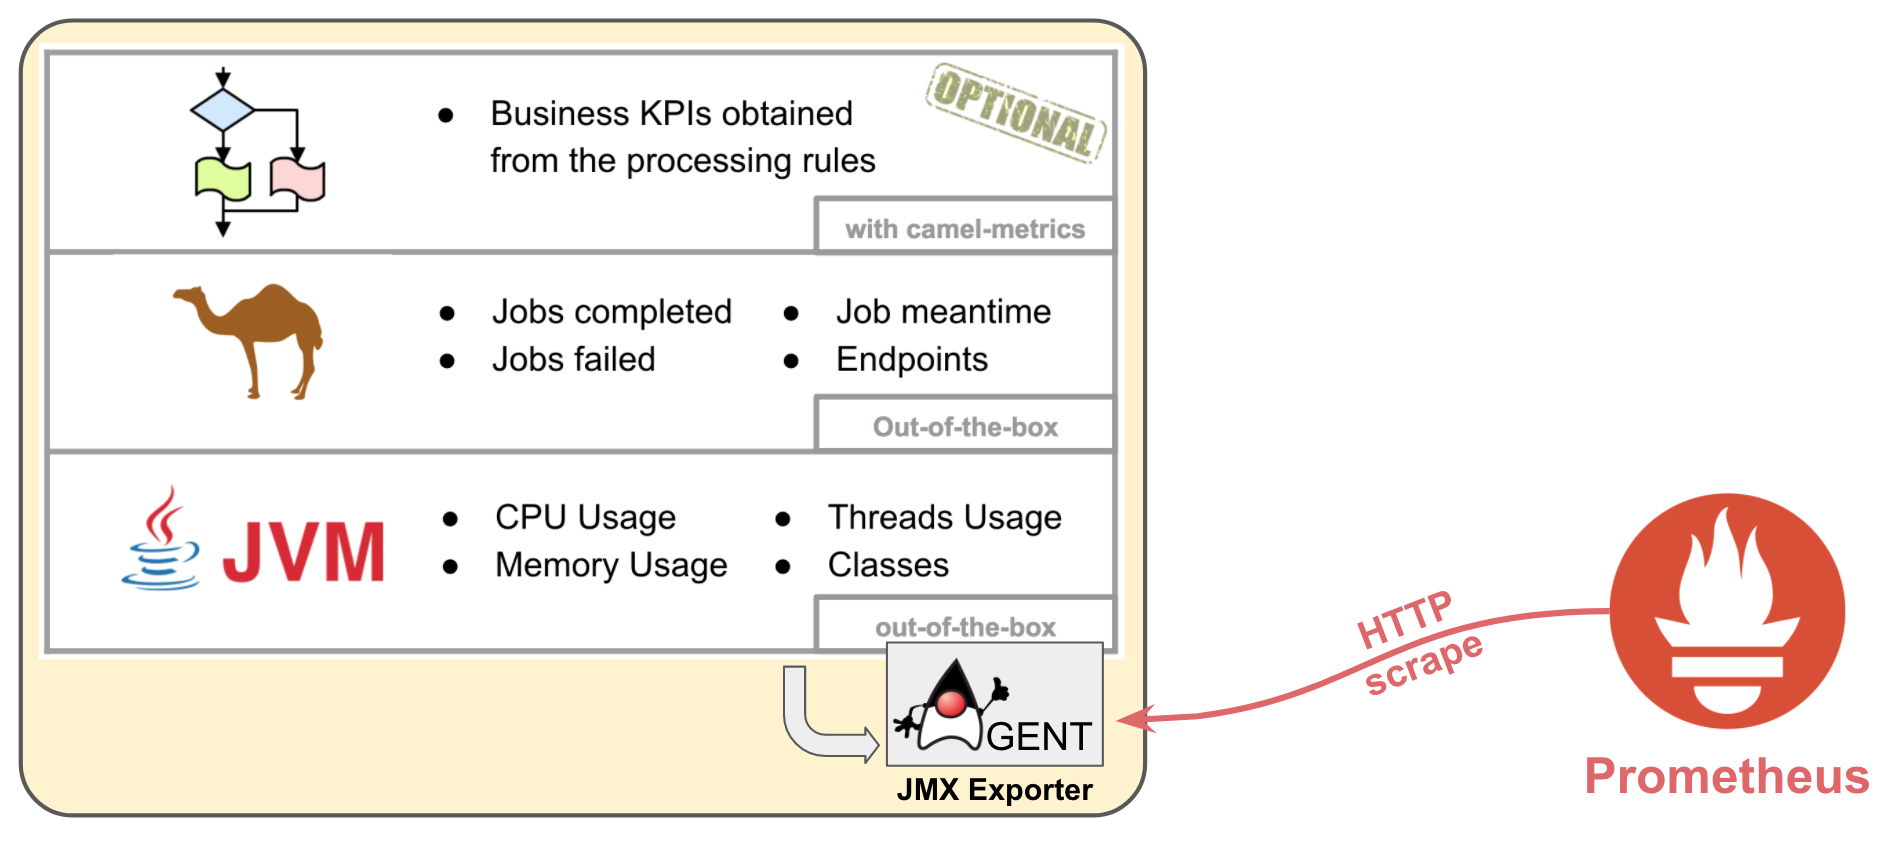
The JMX Exporter has access to MBeans belonging to the 3 layers, and serves the information to Prometheus when requested via HTTP.
Now that we know the principle of ‘scraping’ and what parts are involved, we’re ready to start implementing the solution…
The application
For demo purposes, we’ll pretend that the system exposes an API to provision VMs. A Camel micro-service will handle API calls where the required operating system, number of CPU cores, memory and storage are given to be provisioned.
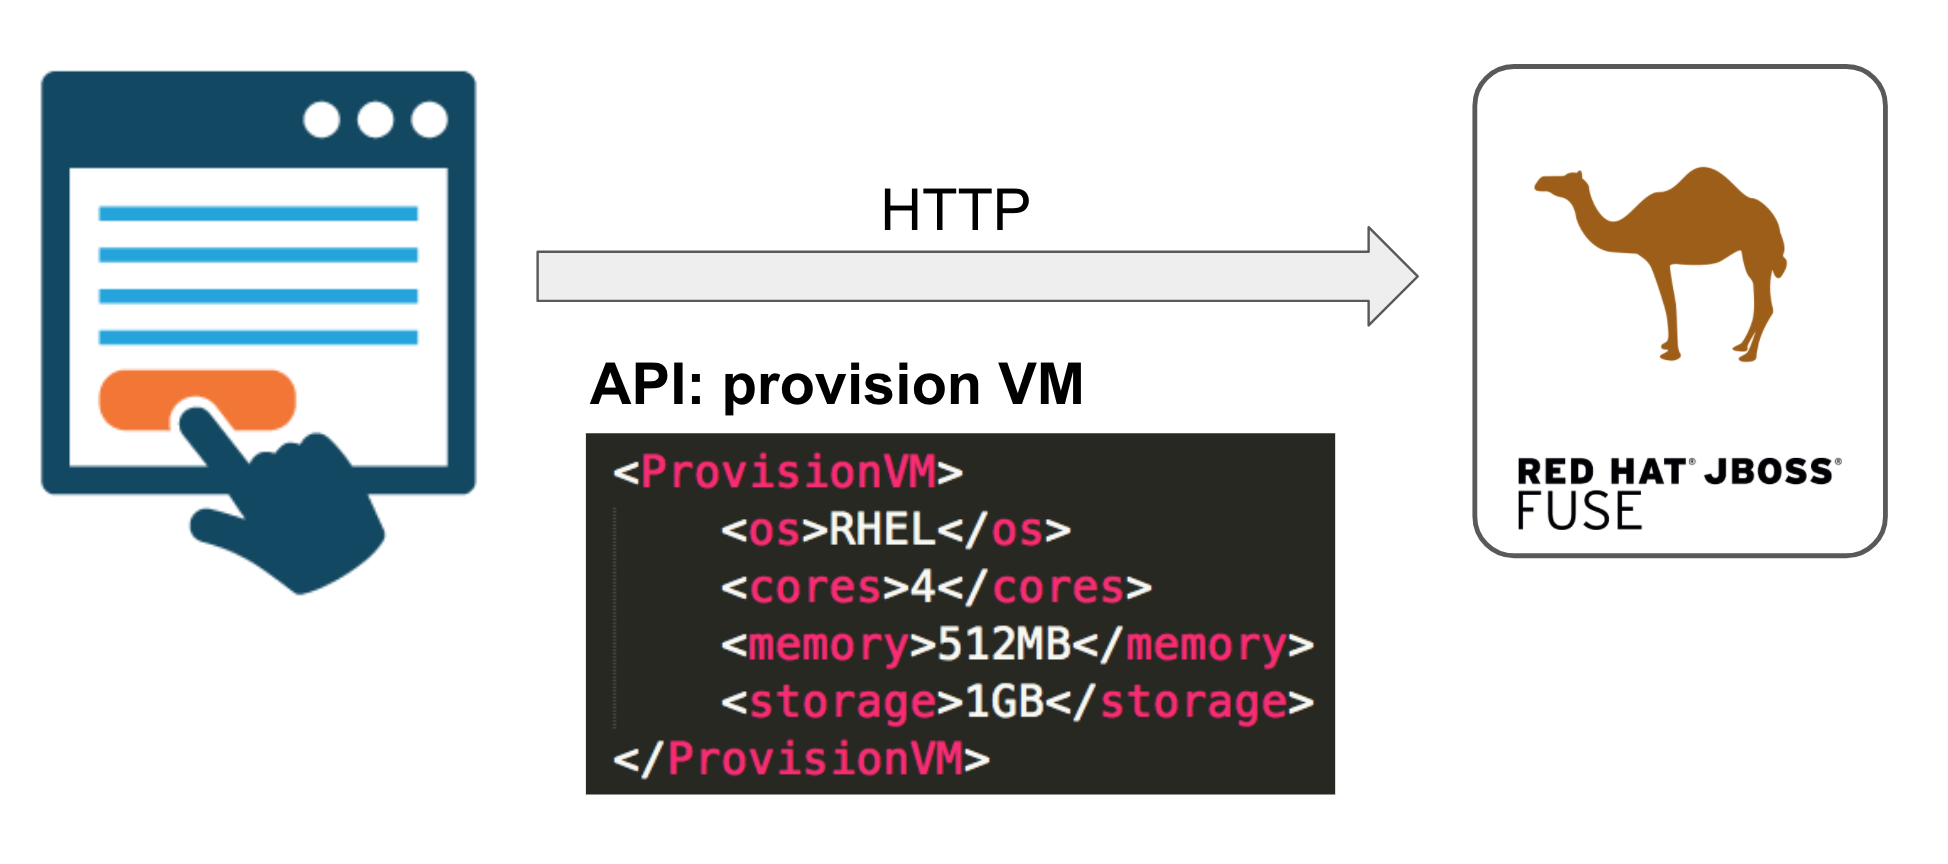
In the proposed use case, clients would select the VM options on screen and trigger the provisioning process. In our demo we’ll simply fire HTTP requests with random VM values from an embedded client in a repeating loop.
And this is the point from which we roll up our sleeves and get our hands dirty. Let’s do it.
Using FIS archetypes, let’s create the base project:
mvn org.apache.maven.plugins:maven-archetype-plugin:2.4:generate \
-DarchetypeCatalog=https://maven.repository.redhat.com/ga/io/fabric8/archetypes/archetypes-catalog/2.2.195.redhat-000007/archetypes-catalog-2.2.195.redhat-000007-archetype-catalog.xml \
-DarchetypeGroupId=org.jboss.fuse.fis.archetypes \
-DarchetypeArtifactId=spring-boot-camel-xml-archetype \
-DarchetypeVersion=2.2.195.redhat-000007
you’ll be prompted to enter the coordinates, for instance:
groupId: fis.demo
artifactId: api-vm-provider
version: 1.0.0
The skeleton should now be ready, let’s add a couple of needed dependencies in the POM file:
<dependency>
  <groupId>org.apache.camel</groupId>
  <artifactId>camel-netty4-http</artifactId>
</dependency>
<dependency>
  <groupId>org.apache.camel</groupId>
  <artifactId>camel-metrics</artifactId>
</dependency>
For executional simplicity, we will also include a client to periodically send provisioning requests.
We’ll create a sample XML from where to randomly pick provisioning values, under:
src/main/resources/samples/os.xml
<root>
  <os>RHEL</os>
  <os>RHEL</os>
  <os>RHEL</os>
  <os>RHEL</os>
  <os>Windows</os>
  <os>Windows</os>
  <os>Ubuntu</os>
  <os>CentOS</os>
</root>
We define an XSLT on the client to help composing the XML request, randomly selecting one of the entries from the sample XML above:
src/main/resources/xslt/os-request.xsl
<?xml version="1.0" encoding="UTF-8"?>
<xsl:stylesheet version="2.0" xmlns:xsl="http://www.w3.org/1999/XSL/Transform">
<xsl:output method="xml" indent="yes"/>
<xsl:param name="random"/>
<xsl:param name="random-os"/>

    <xsl:template match="/">
        <ProvisionVM>
            <os><xsl:value-of select="$random-os"/></os>
            <cores><xsl:value-of select="$random"/></cores>
            <memory>512MB</memory>
            <storage>1GB</storage>
        </ProvisionVM>
    </xsl:template>

</xsl:stylesheet>
Let’s work now on the Camel Spring XML file:
scr/main/resources/spring/camel-context.xml
We now make use of Camel’s functionality to define the bean holding the custom business metrics.
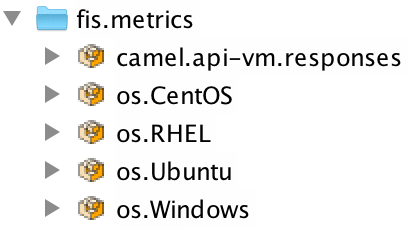
Note the JMX domain given for custom group is ‘
fis.metrics’.
<bean class="org.apache.camel.component.metrics.routepolicy.MetricsRoutePolicy"
        id="policy">
    <property name="useJmx" value="true"/>
    <property name="jmxDomain" value="fis.metrics"/>
</bean>
Replace the main Camel route with the one below exposing the API, defined as:
<route id="api-vm" routePolicyRef="policy">
    <from uri="netty4-http:0.0.0.0:10000/vm/create"/>
    <setHeader headerName="os">
    <xpath resultType="String">//os</xpath>
    </setHeader>
    <log message="Provisioning VM with OS: ${header.os}... done!"/>
    <toD uri="metrics:counter:os.${header.os}"/>
    <setBody><constant>success</constant></setBody>
</route>
The above route listens to VM requests, extracts from the payload the OS value using XPath, and crucially passes it to the metrics component as a counter, which automatically increments by 1 for each OS that comes in.
…as for the provisioning of the virtual machine, well… just imagine it happens!
The client route firing random VM requests is defined as:
<route id="client">
    <from uri="timer:samples"/>
    <to uri="language:constant:resource:classpath:samples/os.xml"/>
    <setHeader headerName="count">
        <xpath resultType="String">count(//os)+1</xpath>
    </setHeader>
    <setHeader headerName="random">
      <simple>${random(1,${header.count})}</simple>
    </setHeader>
    <setHeader headerName="random-os">
      <xpath resultType="String">//os[in:header('random')]</xpath>
    </setHeader>
    <to uri="xslt:xslt/os-request.xsl"/>
    <to uri="netty4-http:0.0.0.0:10000/vm/create"/>
</route>
Done !
Let’s check the implementation works as expected. Build with maven and run locally with the following commands:
mvn clean package
java -jar target/api-vm-provider-1.0.0.jar
You should see the Spring Boot application’s output showing OSs being provisioned:
14:55:47.064 [Camel ...] INFO  api-vm - Provisioning VM with OS: RHEL... done!
14:55:48.066 [Camel ...] INFO  api-vm - Provisioning VM with OS: CentOS... done!
14:55:49.066 [Camel ...] INFO  api-vm - Provisioning VM with OS: RHEL... done!
14:55:50.070 [Camel ...] INFO  api-vm - Provisioning VM with OS: Windows... done!
You can also check the metric bean is available visualising the MBeans with JConsole.
Run 'jconsole' and connect to the local process. Display the MBeans and you should find the group ‘fis.metrics’:
Including the JMX Exporter
The Camel service is now built, we now need to ensure the JMX exporter runs with it. The exporter is a separate entity (JAR file), nothing to do with our service implementation. It can be configured to filter metrics in/out (provided a YAML file).
However, given the target environment is OpenShift, the container needs to include both the application and the JMX exporter (and its configuration). We therefore amend the project to include some extra elements to automate the process of producing an all-in-one container as below described:
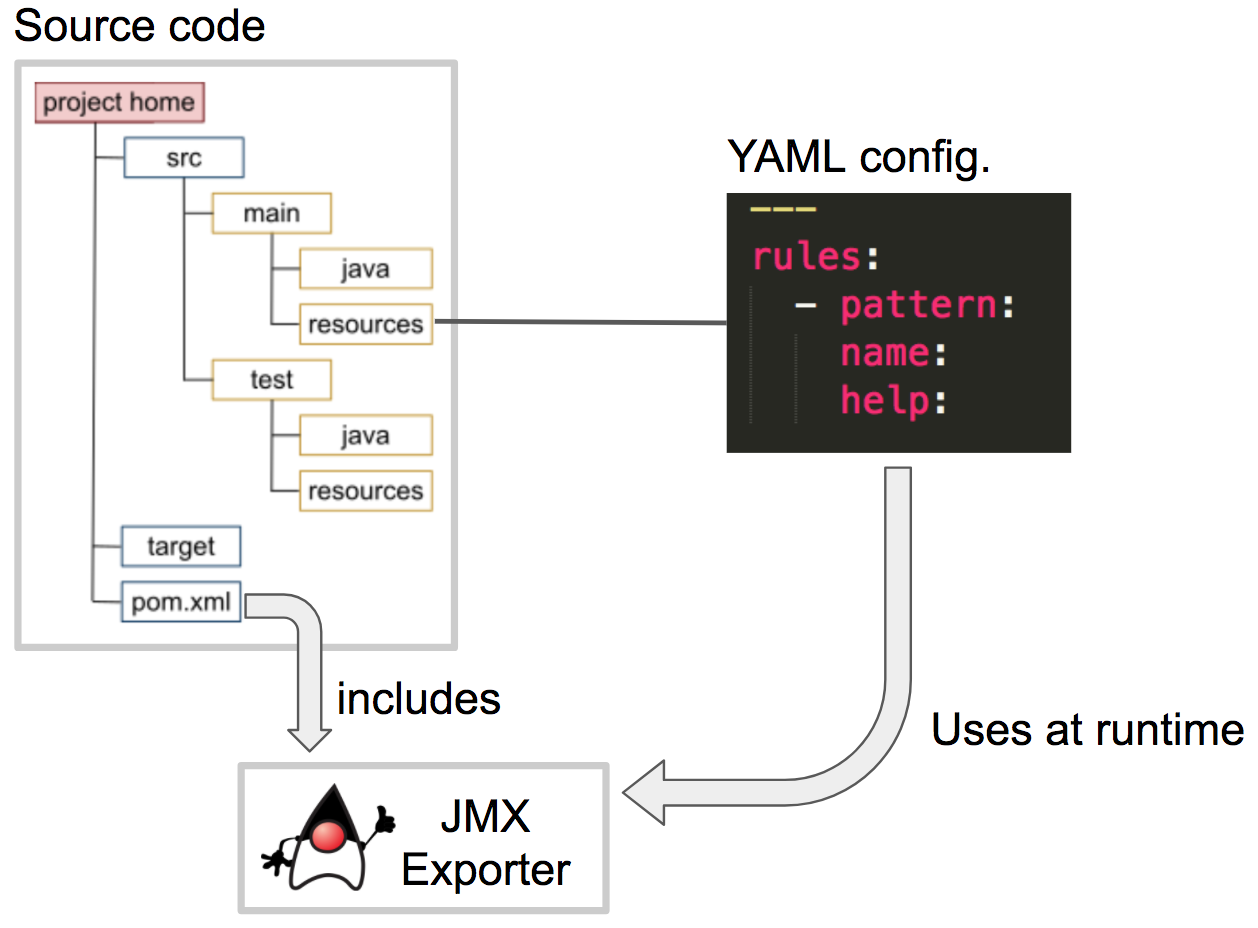
Maven will find the exporter by defining the dependency (plugin) in the POM file as follows:
<plugin>
  <artifactId>maven-dependency-plugin</artifactId>
  <executions>
    <execution>
      <phase>prepare-package</phase>
      <goals>
        <goal>copy</goal>
      </goals>
      <configuration>
        <useBaseVersion>true</useBaseVersion>
        <artifactItems>
          <artifactItem>
            <groupId>io.prometheus.jmx</groupId>
            <artifactId>jmx_prometheus_javaagent</artifactId>
            <version>0.10</version>
            <outputDirectory>${project.build.directory}/docker/${project.artifactId}/${project.version}/build/maven/agent</outputDirectory>
          </artifactItem>
        </artifactItems>
      </configuration>
    </execution>
  </executions>
</plugin>
We purposefully define the ‘docker’ target directory, it will ensure Fabric8 includes the exporter in the container to deploy in Red Hat OpenShift.
We also need to ensure the exporter’s YAML configuration is injected. In the POM file we define where in the Docker container to place the config file:
<plugin>
  <artifactId>maven-resources-plugin</artifactId>
  <executions>
    <execution>
      <id>copy-resources</id>
      <phase>prepare-package</phase>
      <goals>
        <goal>copy-resources</goal>
      </goals>
      <configuration>
        <outputDirectory>${project.build.directory}/docker/${project.artifactId}/${project.version}/build/maven/agent</outputDirectory>
        <resources>
          <resource>
            <directory>src/main/resources</directory>
            <includes>
              <include>config.yml</include>
            </includes>
            <filtering>false</filtering>
          </resource>
        </resources>
      </configuration>
    </execution>
  </executions>
</plugin>
We define a simple YAML configuration with sample rules, as shown below:
src/main/resources/config.yml
rules:
  - pattern: 'fis.metrics<name=os.(.*)><>(.+):'
    name: os_$1
    help: some help

  - pattern: 'org.apache.camel<context=camel, type=routes, name=\"(.*)\"><>LastProcessingTime'
    name: camel_last_processing_time
    help: Last Processing Time [milliseconds]
    type: GAUGE
    labels:
      route: $1
The rules are defined as regular expressions.
- Business metric:
The first rule uses wildcards to pick all our defined OS metrics as seen in JConsole (MBeans). The metric will render as ‘os_name’, (e.g. ‘os_rhel’’). - Camel metric: The second rule picks one of many Camel’s out-of-the-box performance metrics (
LastProcessingTime) and uses the route’s name (it belongs to) as a label (we’ll see labels later).
Having included all the above, re-package the project using maven and launch attaching the JMX Exporter as a java agent:
mvn clean package

java -javaagent:target/docker/api-vm-provider/1.0.0/build/maven/agent/jmx_prometheus_javaagent-0.10.jar=9779:target/docker/api-vm-provider/1.0.0/build/maven/agent/config.yml -jar target/api-vm-provider-1.0.0.jar
The JMX exporter will open port 9779 (default Prometheus port), and use the YAML configuration file to expose the metrics. To confirm the exporter is active, open a browser and hit the following URL
http://localhost:9779
The above simulates a scraping request, as if Prometheus attempted to pull data from the Camel application. The browser should render on screen a list of metrics in return, similar to:
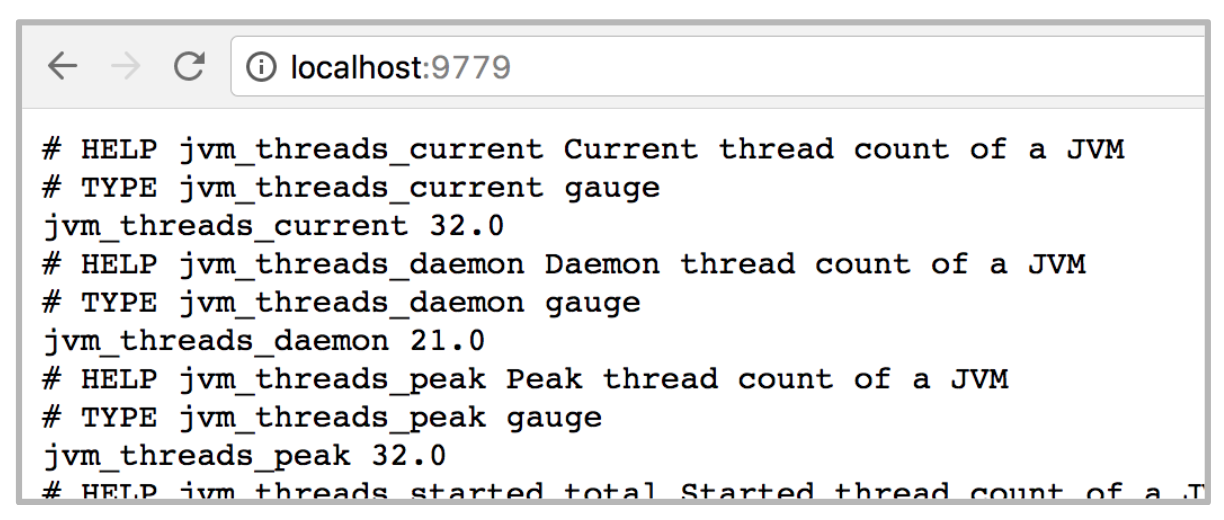
The JMX exporter will by default return some JVM metrics (threads, memory, GC, and others), but it will also include the metrics resulting from the rules configured in the YAML file. In our example, a sample output would be:
# HELP camel_last_processing_time Last Processing Time [milliseconds]
# TYPE camel_last_processing_time gauge
camel_last_processing_time{route="client",} 8.0
camel_last_processing_time{route="api-vm",} 2.0
# HELP os_Ubuntu some help
# TYPE os_Ubuntu untyped
os_Ubuntu 2.0
# HELP os_RHEL some help
# TYPE os_RHEL untyped
os_RHEL 6.0
# HELP os_CentOS some help
# TYPE os_CentOS untyped
os_CentOS 1.0
# HELP os_Windows some help
# TYPE os_Windows untyped
os_Windows 3.0
The above metrics tells us, for instance, there were 6 requests to provision RHEL VMs, and the last request took 2ms to be processed.
The last pending task left to do links well with the next section where the deployment process is described. OpenShift’s java command to launch the application needs to be amended (just as when we manually attached the java agent to run locally). We simply include in the deployment descriptor the JAVA_OPTIONS environment variable to attach the exporter.
Edit the following resource:
src/main/fabric8/deployment.yml
Add the ‘env’ label at the bottom as shown in the sample below:
spec:
  template:
    spec:
      containers:
        -
          resources:
            requests:
              cpu: "0.2"
#              memory: 256Mi
            limits:
              cpu: "1.0"
#              memory: 256Mi
          env:
            - name: JAVA_OPTIONS
              value: -javaagent:agent/jmx_prometheus_javaagent-0.10.jar=9779:agent/config.yml
Deploying in OpenShift’s CDK
Now the Camel application is ready to be containerised and deployed in OpenShift. FIS will do all of it automatically for you in a single command. The directives to bundle together the application and exporter have already been defined. Fabric8 (in FIS) will build a Docker image and include OpenShift resource descriptors. The graph below illustrates how the pieces are put together, streamed and deployed in the target environment.
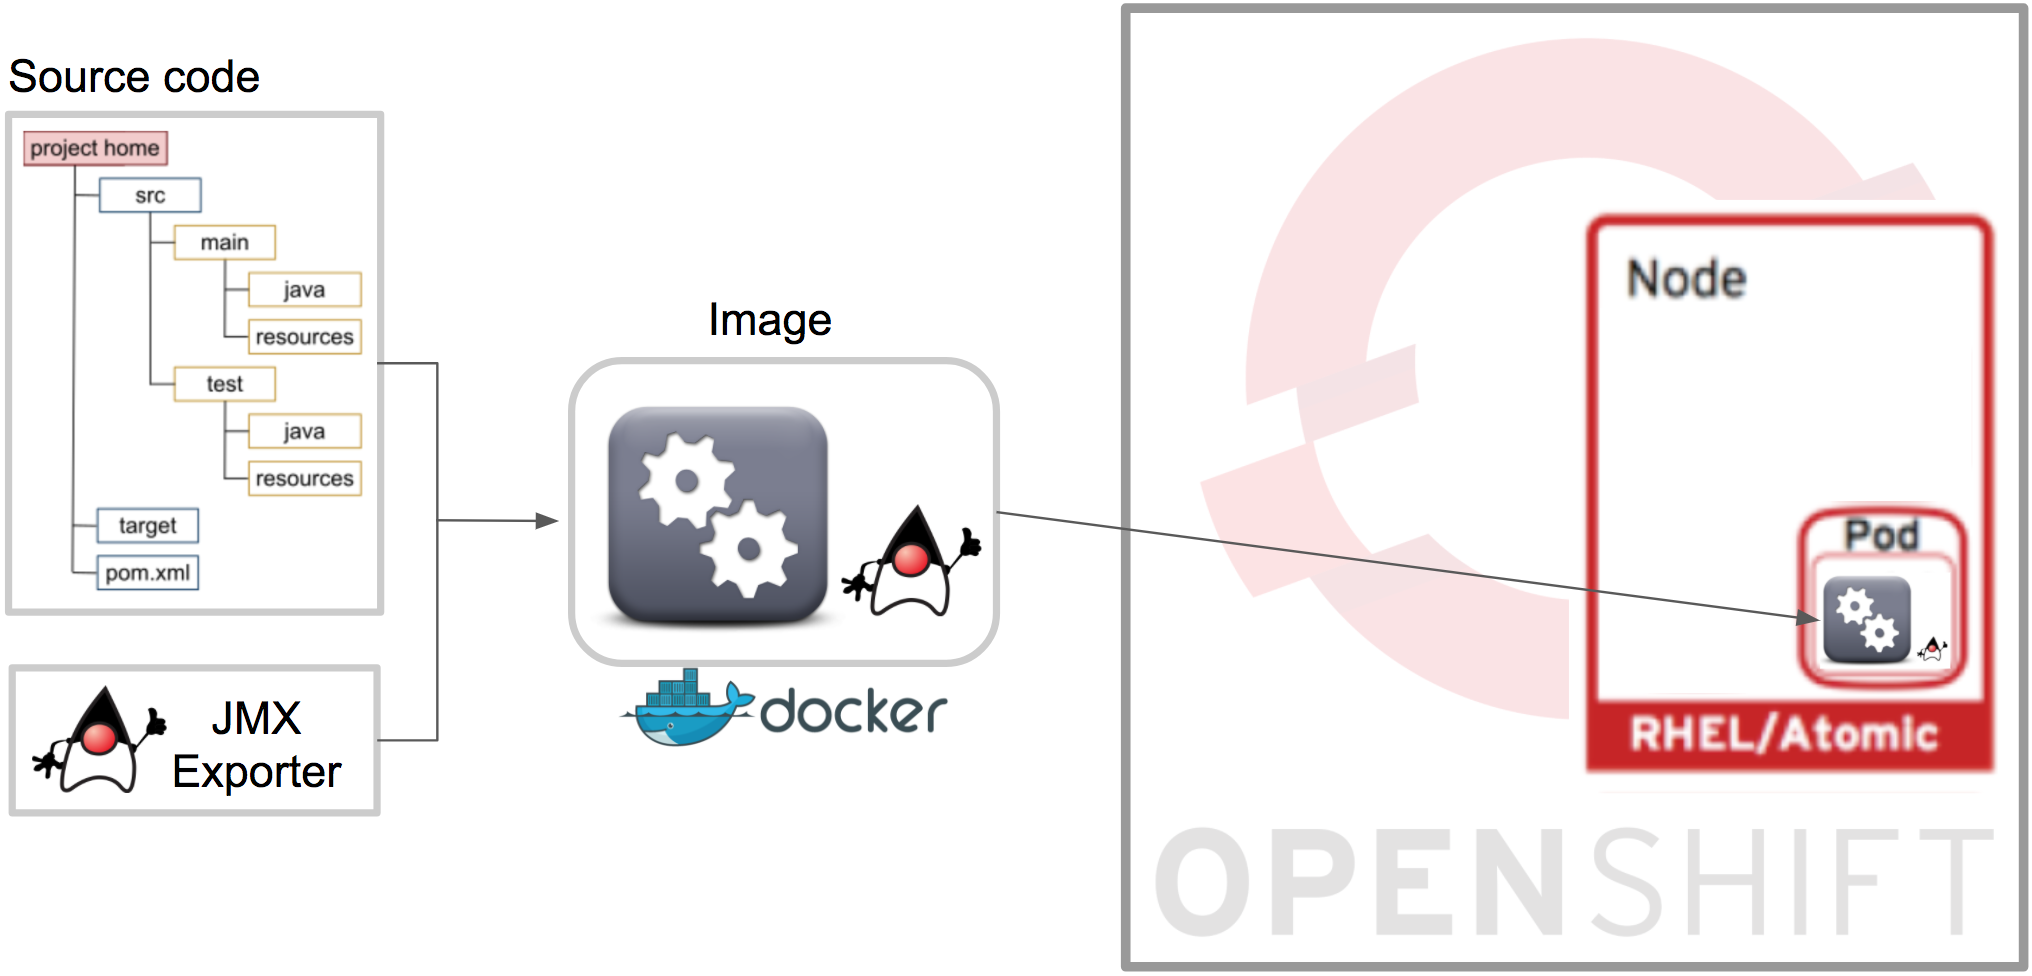
Reaching this stage, ensure you have your Red Hat OpenShift environment up and running ready to be used. the OpenShift client (oc) should also be ready, pointing and logged-in to the CDK.
Create a new project (namespace) in Red Hat OpenShift where to deploy our project.
oc new-project mydemo
The project should be visible in the web console:

To trigger the deployment execute the following command:
mvn clean fabric8:deploy
The first deployment could take several minutes, be patient, subsequent redeployments should happen fast.
When the command completes you should see the pod provisioned in OpenShift:

Let’s check the JMX exporter is active, open the Pod’s terminal and execute ‘curl localhost:9779’ as follows:
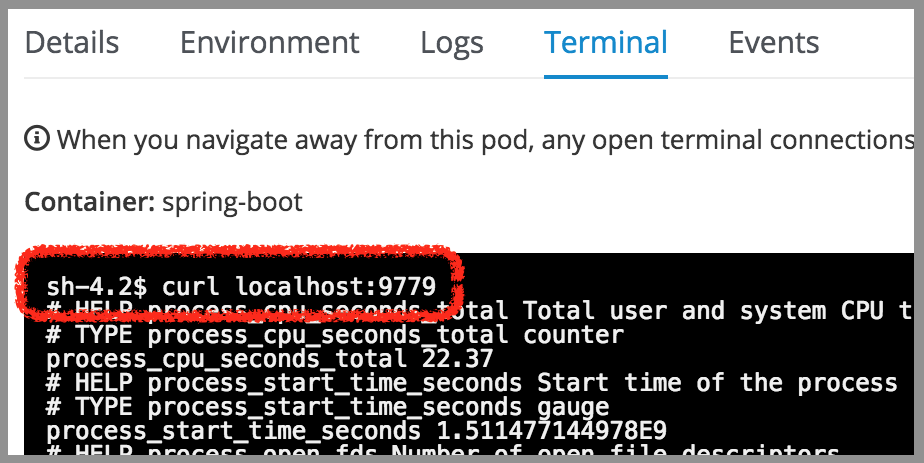
The application should be returning the metrics, as it did when tested locally.
Enabling Prometheus
It is time to deploy Prometheus in our environment. This is a simple process since a Docker image is available. We will customise the image by attaching our own Prometheus configuration file.
Create a Dockerfile with the following code inside:
FROM prom/prometheus
ADD prometheus.yml /etc/prometheus/
The content above pulls the Prometheus image and installs a configuration file under /etc
Now, under the same Dockerfile directory, create a prometheus.yml file and add the following:
# my global config
global:
  scrape_interval:     15s # Set the scrape interval to every 15 seconds. Default is every 1 minute.
  evaluation_interval: 15s # Evaluate rules every 15 seconds. The default is every 1 minute.
  # scrape_timeout is set to the global default (10s).

# Scraping could be configured for specific IPs, or using discovery mechanisms
scrape_configs:

  - job_name: 'my-service-endpoints'
    kubernetes_sd_configs:
    - role: endpoints

    relabel_configs:
    - source_labels: [__meta_kubernetes_service_name]
      action: keep
      regex: api-vm-provider
    - source_labels: [__meta_kubernetes_pod_container_port_name]
      action: keep
      regex: prometheus
We’re keeping a very simple configuration file for this demo, but Prometheus offers a rich palette of parameters allowing to cover most needs. The above settings aim to:
- increase the scraping frequency to trigger every 15 seconds
- enable Kubernetes endpoints discovery
- discard endpoints other than the Camel ones
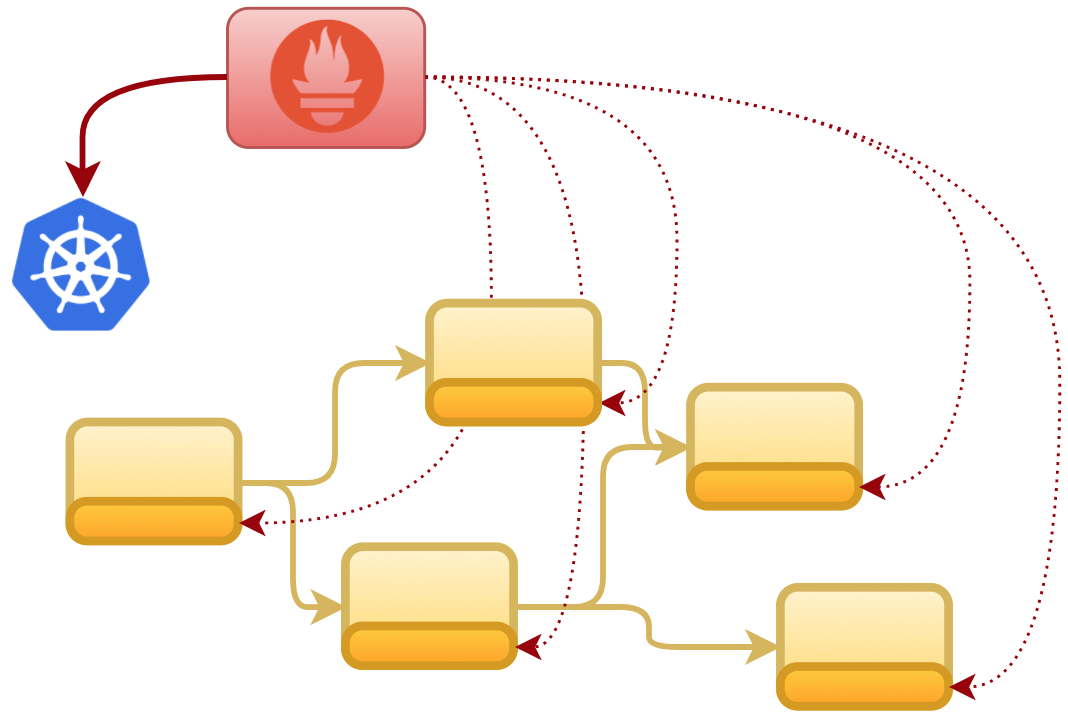
The Kubernetes discovery setting will allow Prometheus to query and obtain the list of available endpoints and their connectivity details. Prometheus will include in its catalog all the endpoints retrieved to allow the scraping process to hit them, as the figure below illustrates:
To initiate the deployment process in Red Hat OpenShift, first we need to grant cluster permissions on the namespace to allow Prometheus to invoke Kubernetes API (when obtaining the endpoints). Execute the following commands to login as an admin and grant cluster permissions:
oc login
oc adm policy add-cluster-role-to-user cluster-reader system:serviceaccount:mydemo:default
Next, create and start a new prometheus build from the directory where the Docekfile is located.
oc new-build --binary --name=prometheus
oc start-build prometheus --from-dir=. --follow
The first start-build execution takes long to complete, be patient. Once the build finished, create a new Prometheus application and expose it to allow external access to its administration console, as follows:
oc new-app prometheus
oc expose service prometheus
The new Prometheus pod should then be visible in the Red Hat OpenShift console.
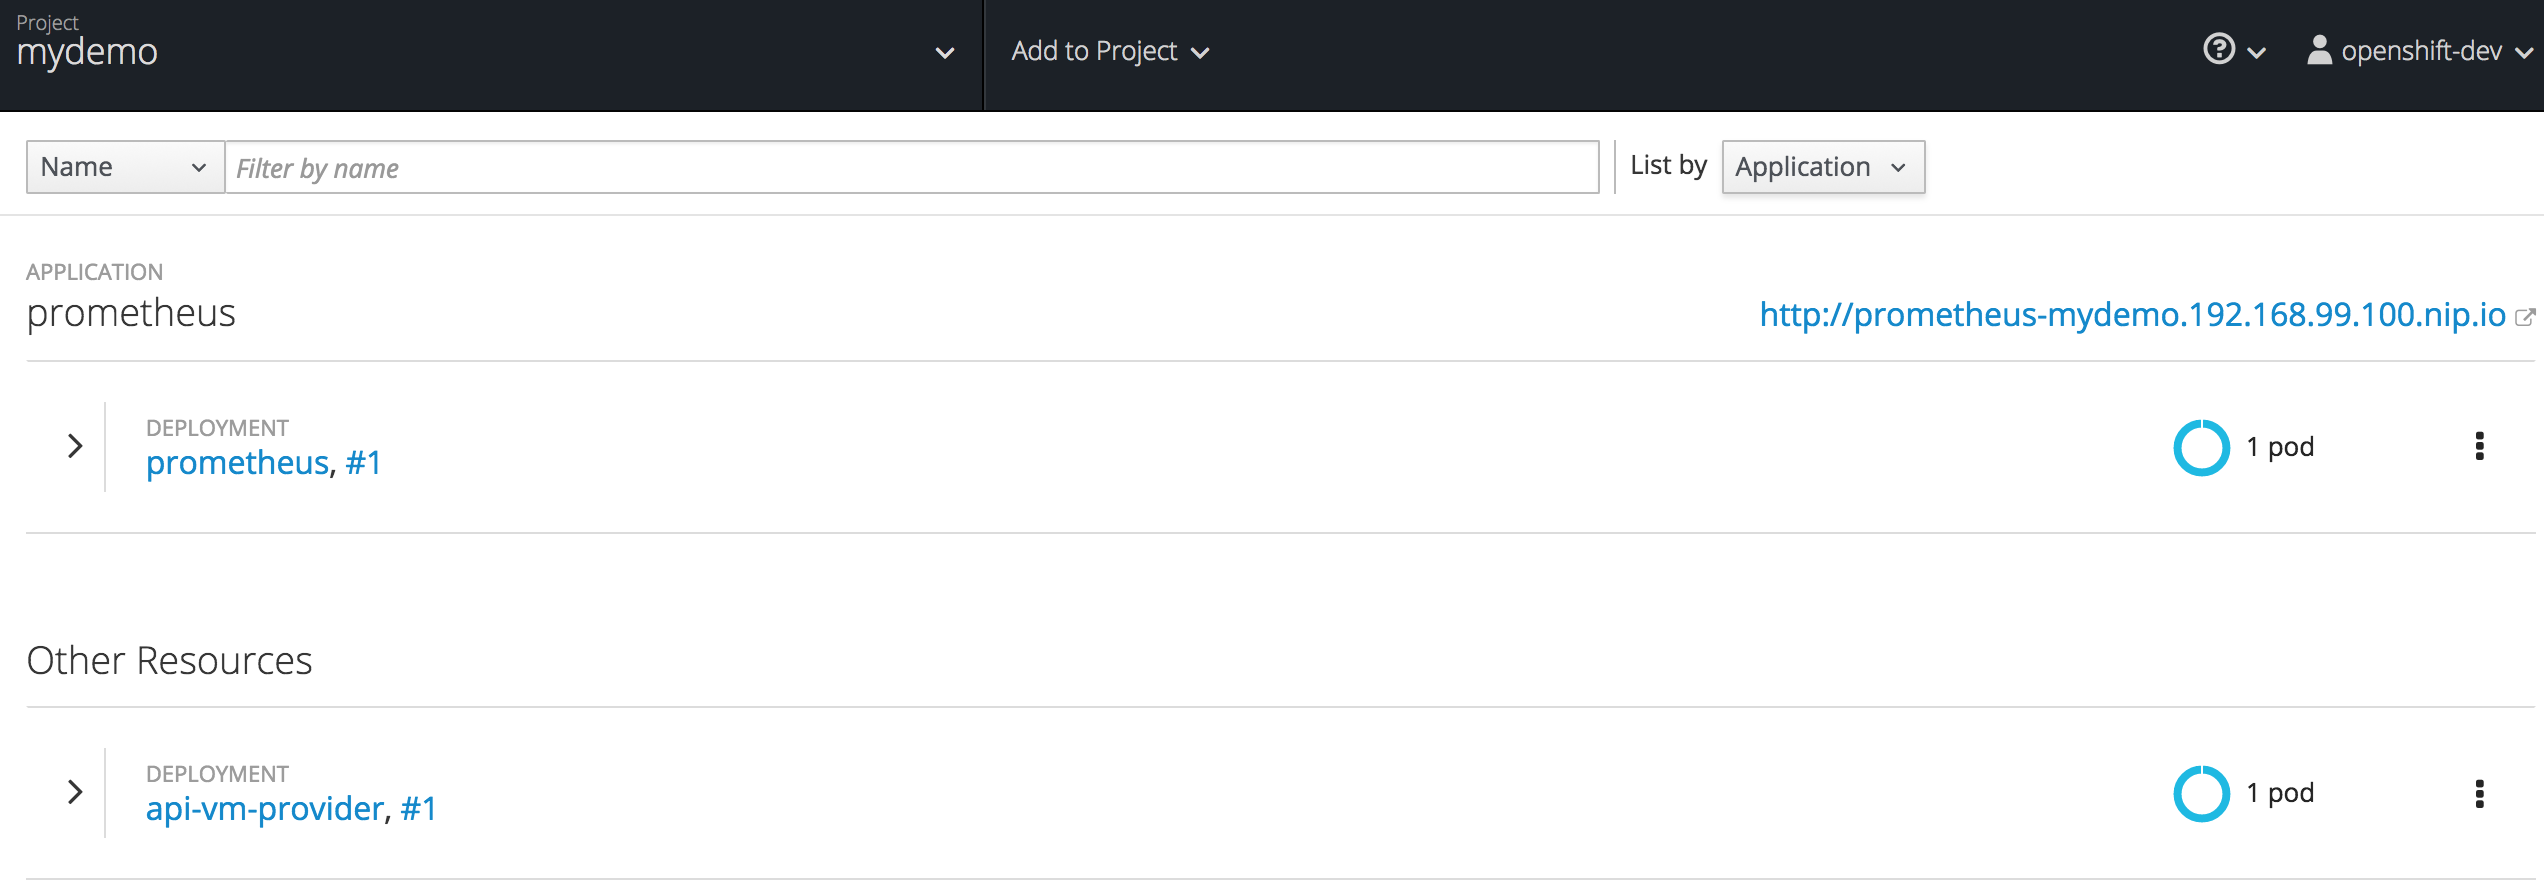
Open Prometheus administration console from the URL given (see URL in image above). Then from the ‘Status’ menu select ‘Targets’.
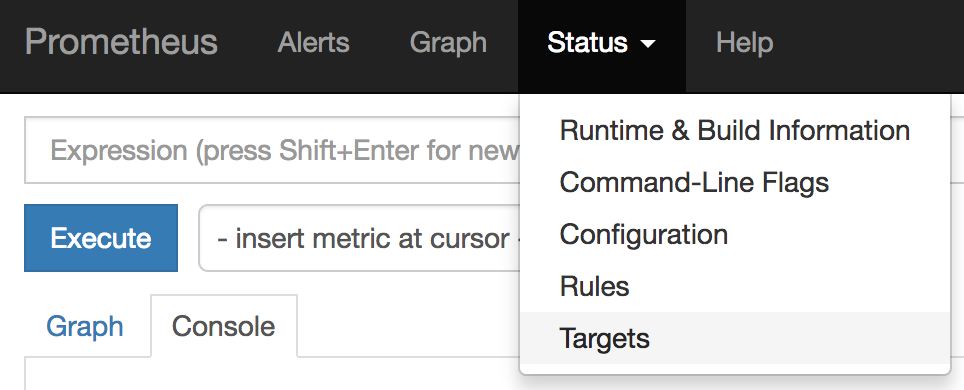
The UI will display the list of targets registered, the ones that we should see available are from our Camel application on port 9779. At this stage only one instance should be visible.

We could therefore represent the current deployment picture as follows:
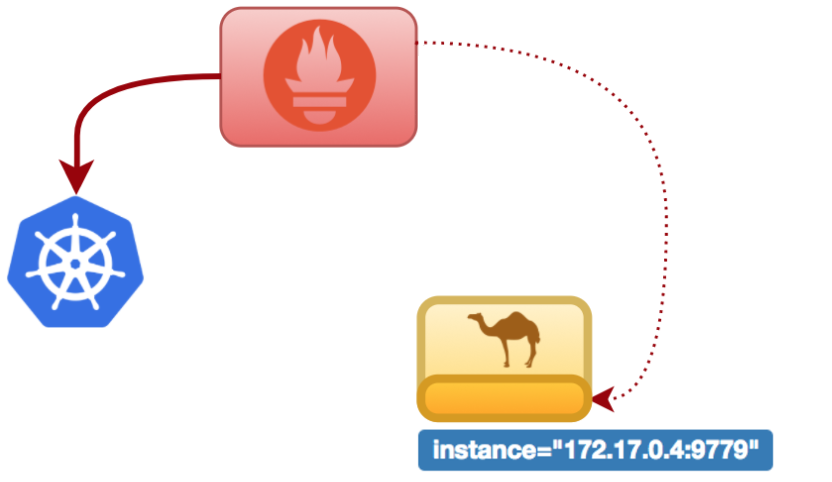
Let’s now scale up the application to simulate we respond to more demand. This is the big moment we were waiting for to see how our monitoring solution automatically reacts to changes in the environment.
When scaling up from the Pod control in Red Hat OpenShift, Kubernetes will kickoff a new pod. Shortly after, Prometheus will query again Kubernetes and will discover there’s a new endpoint available, it will automatically pick it up and now will be scraping data from both pods. The following illustration should describe the new environment status when increasing the number of pods from 1 to 2.

Refresh the targets list to see the new endpoint is visible.

Note Prometheus administration console includes a graph viewer useful for simple testing, but not rich enough for instance to display complex aggregated views. If you will, have a go and play around a bit, but we’ll jump now straight to the following section, It’s Grafana time!
Enabling Grafana
Grafana is an open platform for analytics and monitoring capable of rendering very intuitive and interactive graphics out of multiple data sources, one of them being Prometheus. Our intention is therefore to plug Grafana into Prometheus to display our Camel application metrics.
To deploy an instance of Grafana in Red Hat OpenShift I’ve taken as a base the demo prepared by the OpenShift team available (available here).
I’ve customised the example by updating to the latest Grafana version (4.4.1) and including a Grafana plugin to render pie charts (not included by default). Download the plugin from Grafana’s download link and unzip the contents in your local grafana working directory (assuming you’ve created one), or alternatively use the commands below:
mkdir grafana
cd grafana
curl -L -o grafana-piechart-panel.zip https://grafana.com/api/plugins/grafana-piechart-panel/versions/1.1.6/download
unzip grafana-piechart-panel.zip
mv grafana-piechart-panel-* grafana-piechart-panel
Please note the plugin’s final directory has been renamed for easy reference to use later on.
Create the customised Dockerfile definition as follows:
FROM centos:7
MAINTAINER Erik Jacobs <[email protected]>

USER root
EXPOSE 3000

# VERSION UPDATE
#ENV GRAFANA_VERSION="4.3.1"
ENV GRAFANA_VERSION="4.4.1"

ADD root /
RUN yum -y install https://s3-us-west-2.amazonaws.com/grafana-releases/release/grafana-"$GRAFANA_VERSION"-1.x86_64.rpm \
    && yum clean all
COPY run.sh /usr/share/grafana/
RUN /usr/bin/fix-permissions /usr/share/grafana \
    && /usr/bin/fix-permissions /etc/grafana \
    && /usr/bin/fix-permissions /var/lib/grafana \
    && /usr/bin/fix-permissions /var/log/grafana

# PIE CHART PLUGIN
COPY grafana-piechart-panel /var/lib/grafana/plugins/grafana-piechart-panel
COPY grafana-piechart-panel /usr/share/grafana/plugins/grafana-piechart-panel

WORKDIR /usr/share/grafana
ENTRYPOINT ["./run.sh"]
The above Dockerfile depends on two shell scripts to apply necessary fixes to enable ‘write’ permissions on the container to allow Grafana to use its local storage. Create the following two scripts (or copy them from the OpenShift example):
run.shroot/usr/bin/fix-permissions
‘run.sh’ looks as follows:
#!/bin/bash

source /etc/sysconfig/grafana-server

[ -z "${DATAD} ] && DATAD=${DATA_DIR}
[ -z "${PLGND} ] && PLGND=${PLUGINS_DIR}

if [ ! -z "${GF_INSTALL_PLUGINS}" ]; then
  OLDIFS=$IFS
  IFS=','
  for plugin in ${GF_INSTALL_PLUGINS}; do
    grafana-cli --pluginsDir ${PLGND} plugins install ${plugin}
  done
  IFS=$OLDIFS
fi

/usr/sbin/grafana-server \
--config=${CONF_FILE} \
--pidfile=${PID_FILE} \
cfg:default.paths.logs=${LOG_DIR} \
cfg:default.paths.data=${DATAD} \
cfg:default.paths.plugins=${PLGND}
‘root/usr/bin/fix-permissions’ contains:
#!/bin/sh
# Fix permissions on the given directory to allow group read/write of
# regular files and execute of directories.
chgrp -R 0 "$1"
chmod -R g+rw "$1"
find "$1" -type d -exec chmod g+x {} +
Remember to set ‘execute’ permissions on both scripts:
chmod +x root/usr/bin/fix-permissions
chmod +x run.sh
All our Grafana deployment definitions are ready, let’s deploy.
Create and start a new Grafana build from the same Grafana working directory (where ‘Dockerfile’ is located).
oc new-build --binary --name=grafana
oc start-build grafana --from-dir=. --follow
The first start-build execution takes long to complete, be patient. Once the build finished, create a new Grafana application and expose it to allow external access to its administration console, as follows:
oc new-app grafana
oc expose service grafana
The new Grafana pod should then be visible in the Red Hat OpenShift console.

Grafana’s UI
Open Grafana’s web console from the URL given (see URL in image above), and login with the default credentials (admin/admin). You will land on the ‘Home Dashboard’ where you will notice the ‘Pie Chart’ plugin was successfully installed:

First thing to do is to configure connectivity with Prometheus data source. Click on ‘Add data source’.

and define the name, type of data source and URL (default port is 9090) as shown in the caption below:
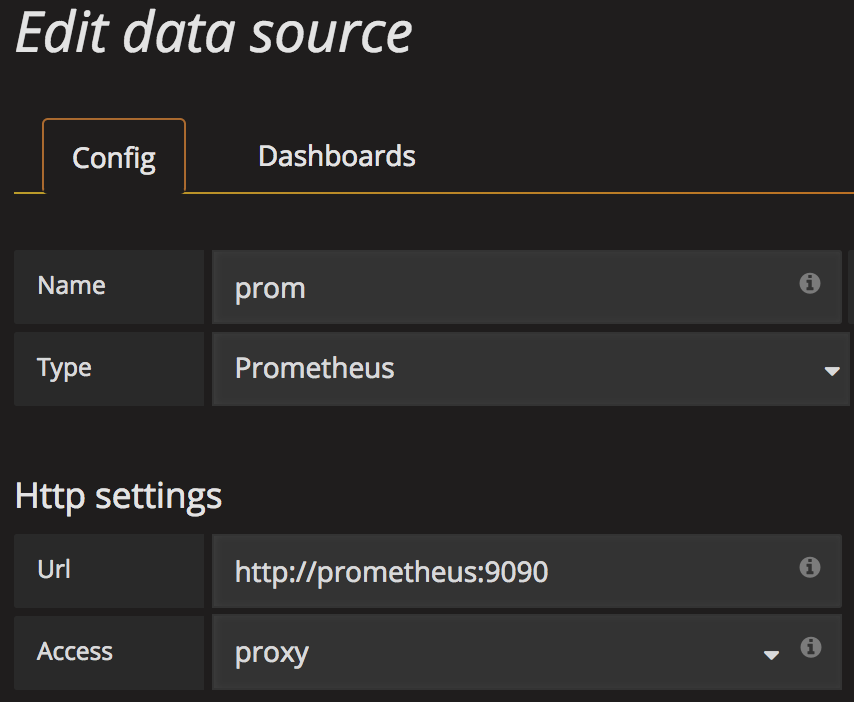
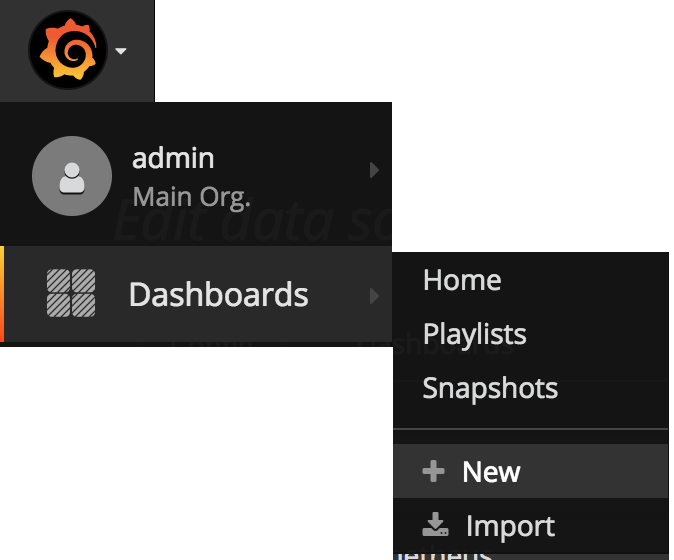
then click ‘Add’ and Grafana will attempt to connect. If no trouble arises, it will display ‘success’ in green color. We should now have Grafana linked to Prometheus. Create a new dashboard where to layout rendering panels for the metrics.
Quick recap, we counted three metric layers we’re interested in (picture below) and would like to render their data for analysis. Let’s create an example graph for each layer.
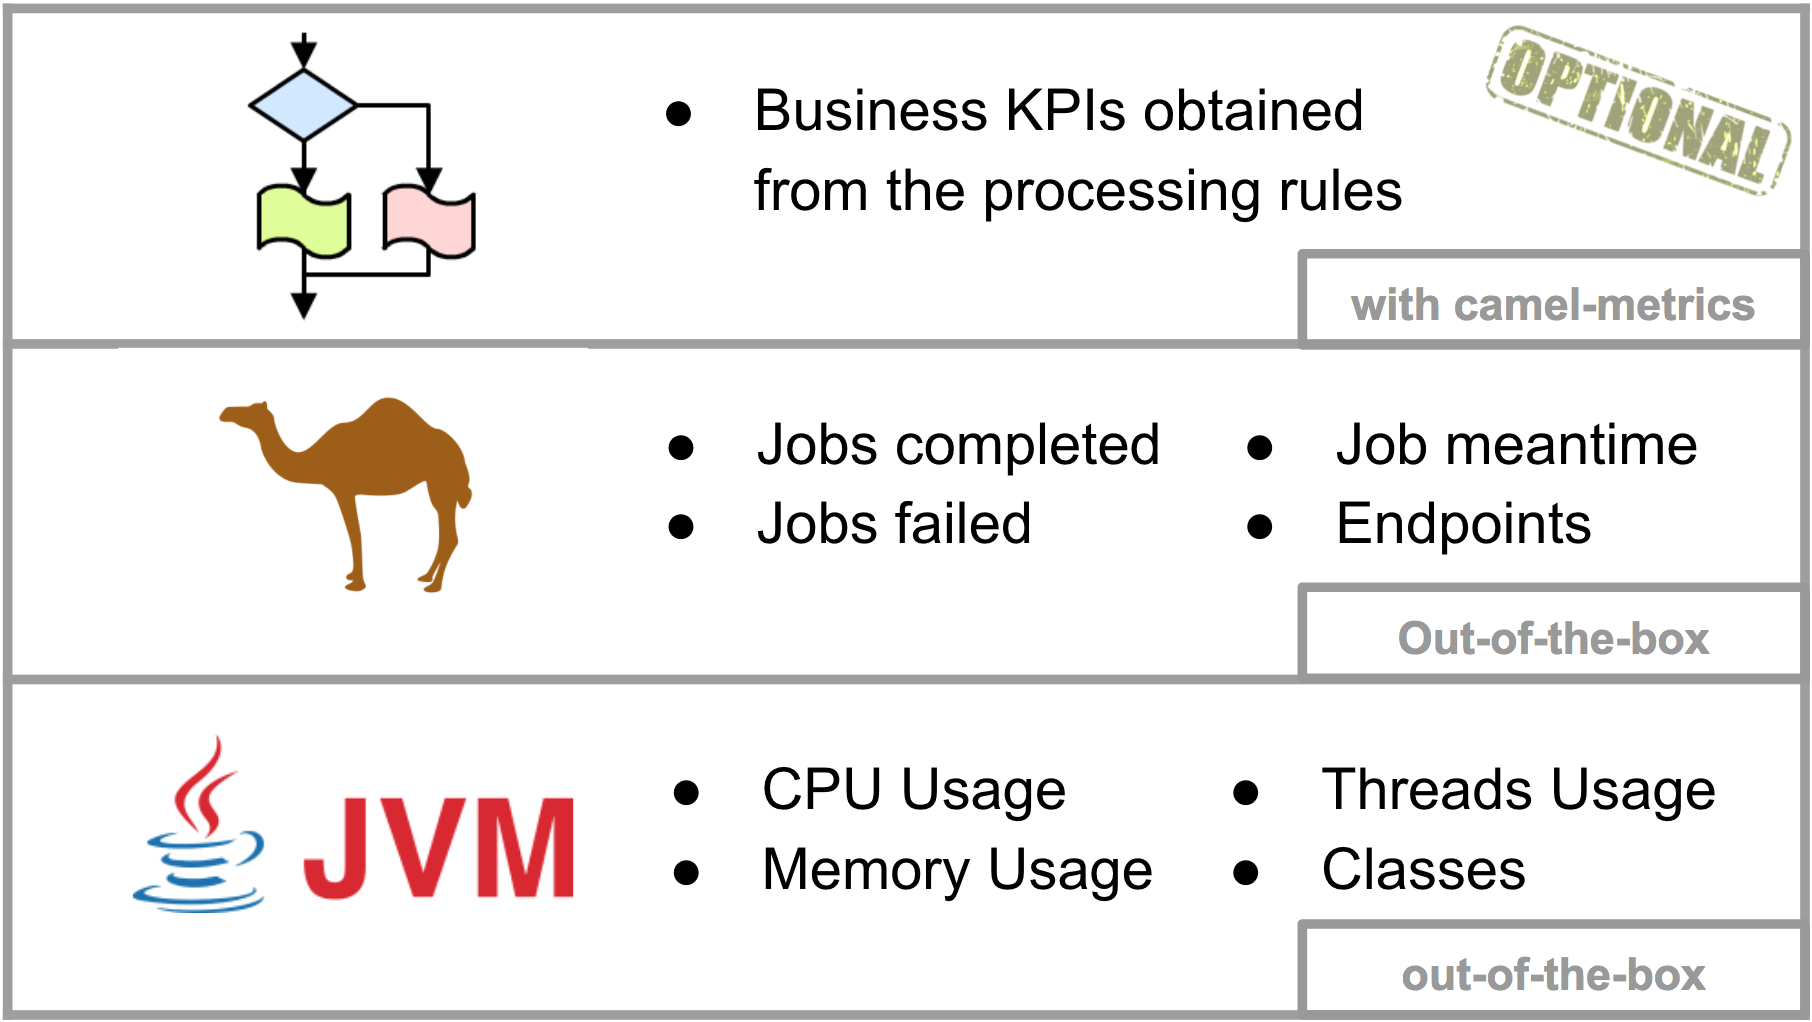
Starting from the bottom layer (JVM), let’s display its memory usage. Drag and drop a Graph in the empty space, click on the ‘Panel Title’ and select ‘edit’. In the ‘metrics’ tab you’ll find a ‘Panel Data Source’ selection box, choose ‘prom’ (our defined data source). Now, we can choose the metric to display from the ‘Metric lookup’ selection box. Grafana auto-populates the metrics list from querying Prometheus, it will include all of them, found by the scraping process, in alphabetical order.
Select from the list ‘jvm_memory_bytes_used’ and change the time range at the top right corner to 15min for example.

For the second layer (Camel metrics), create a second panel, drag and drop a new Graph and pick the ‘camel_last_processing_time’ metric.

For the top layer (Business), create another Graph panel, and pick ‘os_RHEL’ and ‘os_CentOS’ metric. We should see a comparison between RHEL VMs being provisioned against CentOS, similar to the picture below:

You’ll notice four curves are being displayed corresponding to the 2 selected metrics from the 2 pods running. You will also notice RHEL is the most popular out of the 2, this makes sense since we made our client to send RHEL requests with higher probability than the other flavours. Also, you’ll realise Prometheus automatically defined labels to identify where the metrics are coming from.
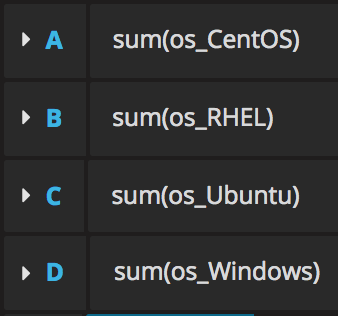
Let’s introduce some data aggregation rules to play a bit with the power of Grafana. The Pie Chart plugin will give us a better sense of the distribution of operating systems being provisioned. The origin of the data no longer matters, the same metrics from the different pods are added up, whether 2 or 10 pods are running. Create a new Pie Chart panel and define the following 4 queries using the sum() function, and customise the metric labels using the input field ‘Legend format’.
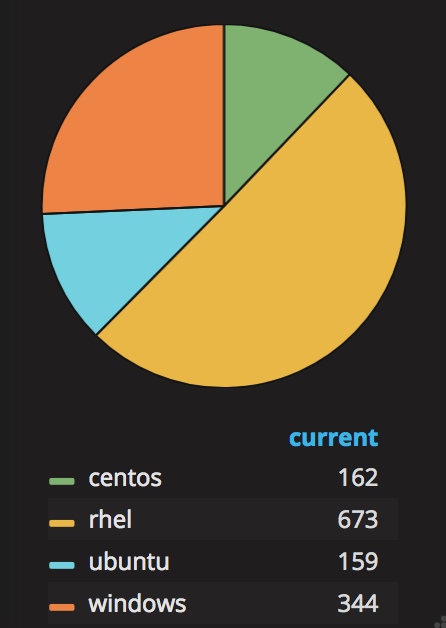
The above chart shows RHEL is the most popular OS, followed by Windows, then CentOS and Ubuntu.
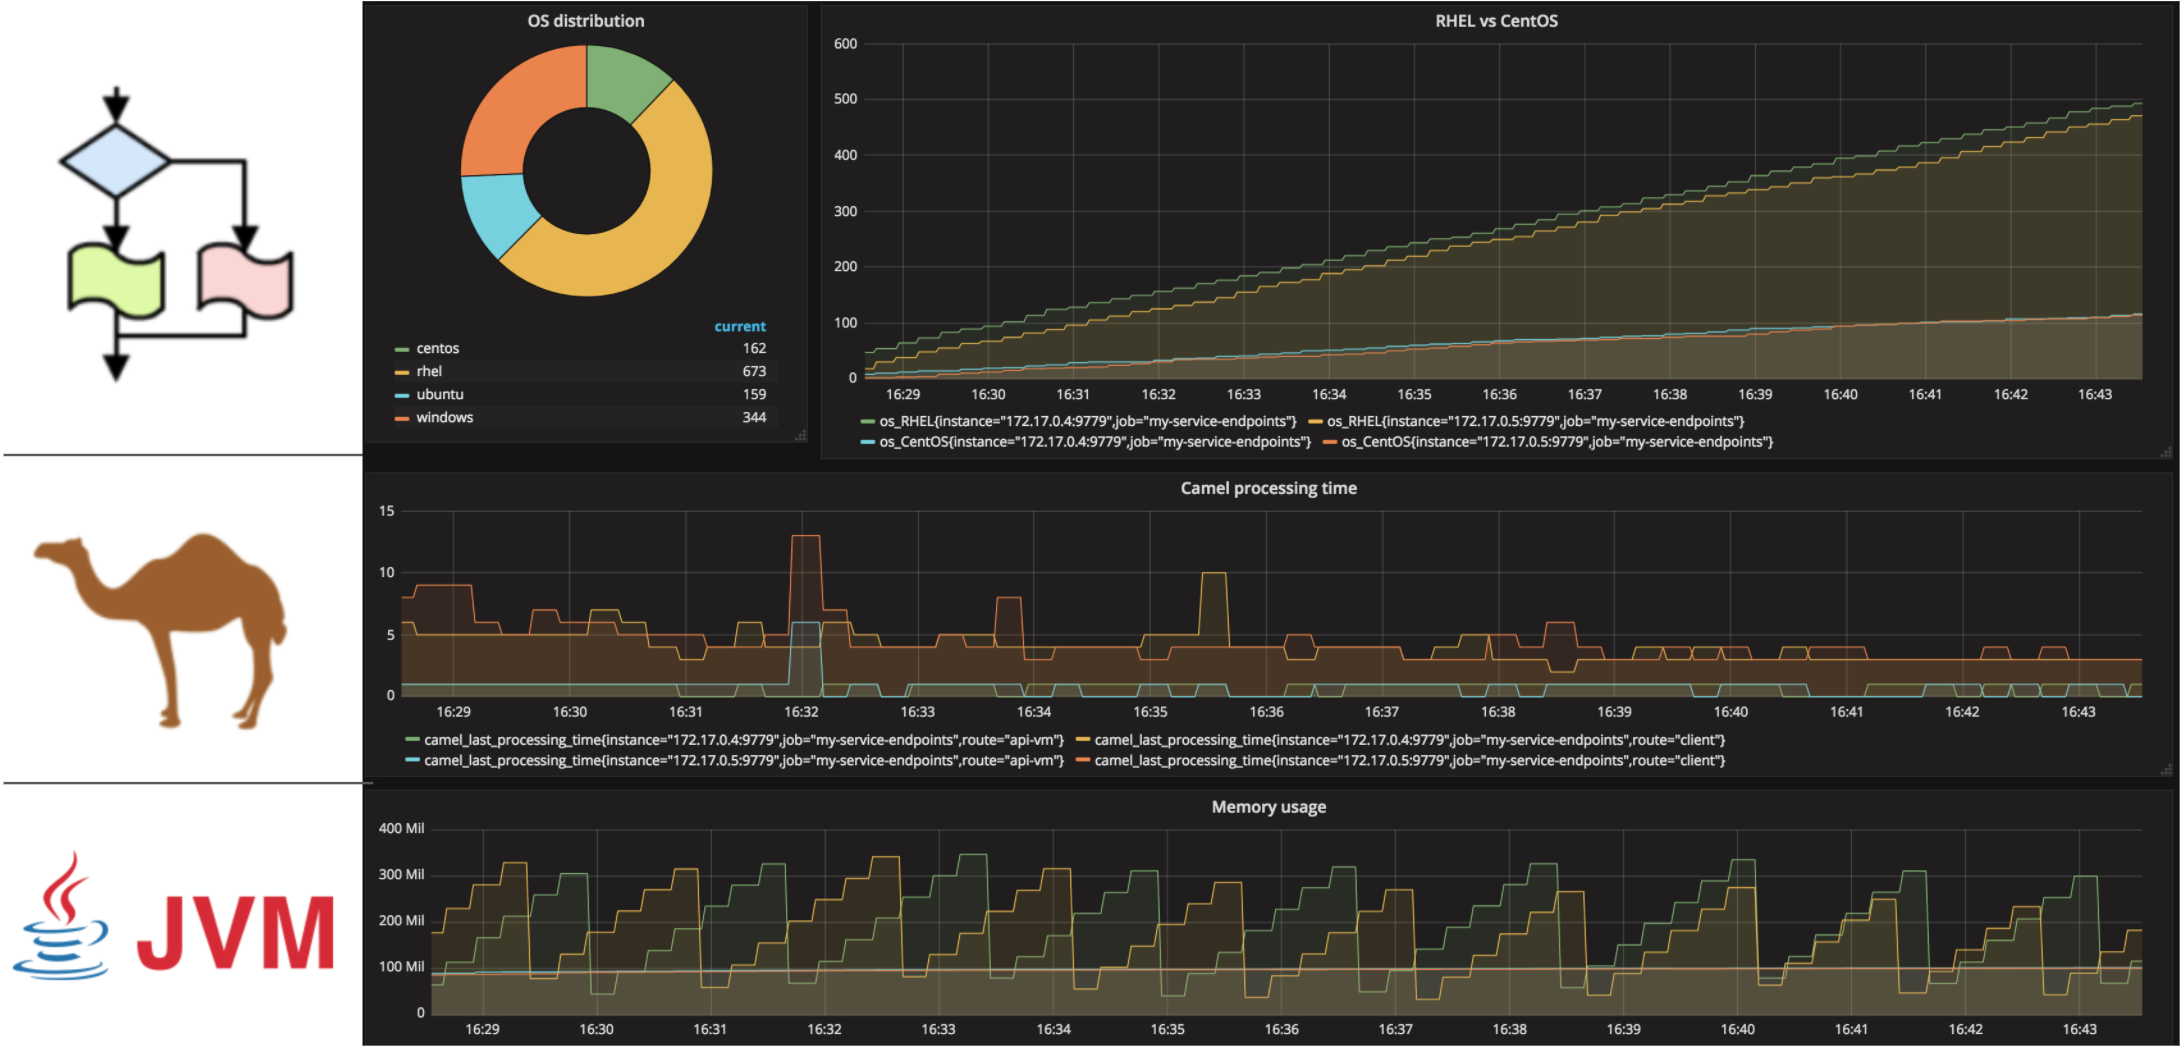
The illustration below summarises all the work done above, showing the three metric layers of the application (JVM/Camel/Business) and a full construct in Grafana side by side:
Scaling down
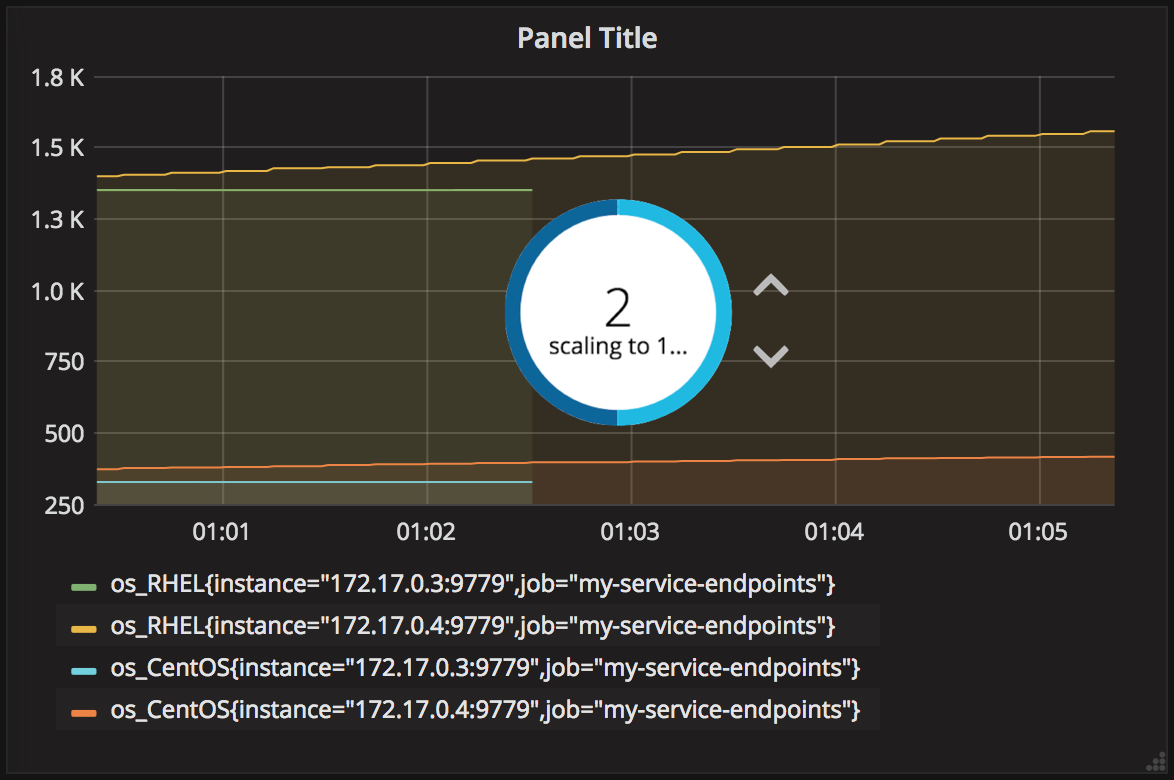
We can play around a bit more and see what happens if we scale down the Camel application from 2 pods to 1. Doing so should cause some of the curves to stop growing, and eventually discontinue as the target is no longer available. It would look like the picture below:
Final words
This whole exercise was about taking advantage of a container based environment and showing how to put in place a monitoring strategy capable of self-adjusting when the application landscape is constantly re-shaping.
The article was Camel centric, but I’m sure you can foresee how this goes beyond the world of Camel. Any application running in a Pod could perfectly be incorporated and fall into Prometheus radar.
I’m well aware the article got quite long, if you’re still reading here I’m going to assume it got you sufficiently interested and that’s a good sign! Thanks for reading !
Find in my GitHub account all the source code and definitions from this article:
https://github.com/brunoNetId/example-camel-prometheus-grafana-openshift


One reply on “Monitoring Camel with Prometheus in Red Hat OpenShift”
[…] interested on monitoring topic on Red Hat integration solutions, I recommend having a look at Bruno Meseguer excellent blog post that was an inspiration for reproducing on AMQ what was done on […]